
The operational-efficiency-analysis software system has been developed for creating automatic passenger surveys. The basic data (stops, tracks, lines, line variants, and routes) is transferred from a timetable system. The software system can be used to calculate a wide variety of variables, such as average route load (passengers), average stop and traffic loads (passengers), daily load curve of passengers (number of people boarding), etc., and to output the data in the form of graphs or tables.
An analysis can only ever be carried out over a particular timetable period. A specific period to be analyzed can be defined from within that timetable period.
Average route load
The average route load represents the average number of people boarding per route and per type of day for a particular section of a route, which the user can define.
Average stop and traffic loads
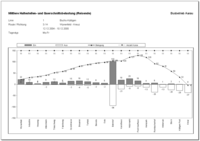 The average stop and traffic loads illustrate the average number of people boarding and alighting, as well as the average occupancy (number of passengers in the vehicle when it departs from a stop), per type of day at a stop on a selected route.
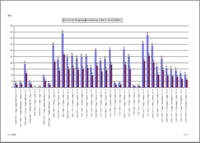
Daily load curve of passengers
The daily load curve of passengers illustrates the average number of people boarding per hour. It should be noted here that the time specified refers to the departure time of the journey in question, not to the actual time at which people boarded at the relevant stop.
 Variables (people boarding/alighting)
The variables table contains data relating to each line and survey - for both directions individually and taken together - for an average Monday to Friday, an average Saturday, an average Sunday, and an average Monday to Sunday.
ISÖV variables (boarding/alighting)
ISÖV stands for Indikatoren- und Verkehrsdatensystem Öffentlicher Regionalverkehr (indicator and traffic-data system for regional public transport)
The annual and/or average daily values for all of the company's lines are calculated, based on the ratio of scheduled journeys to those actually paid for within the specified period.
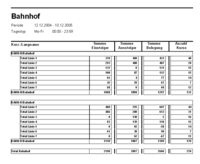
Stops (people boarding/alighting)
Various variables are output for the selected stop(s) and the defined period for each line which uses this stop.
In addition, a daily load curve (hourly values) of the variables described above can be output for each stop.
Paid journeys
A table containing details of the paid journeys and those actually made is created for a particular period. You can choose whether to display the data based on lines or on circuits.
The analysis "summary based on circuits and operating days" illustrates for each circuit and operating day how many journeys were made per circuit and how often those journeys were paid for.
Utilization of circuits
 A report is created, which illustrates in chronological table format the maximum load, the utilization based on seats, and the utilization based on total space available for each journey on the one hand, and shows in chronological graphic format the maximum load and the utilization based on total space available for each journey on the other.